 Data Analytics
R-Shiny
Shiny is a web application framework for R language from the developers of RStudio. Shiny can easily turn your analyses into interactive web applications. There is no need to know HTML, CSS, or JavaScript.
Some Shiny app examples
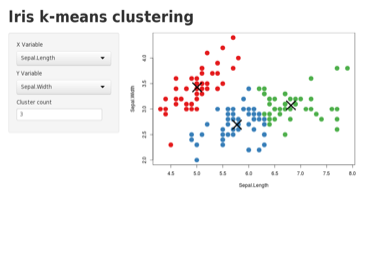
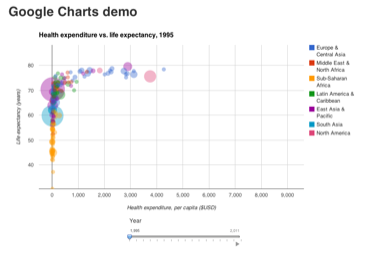
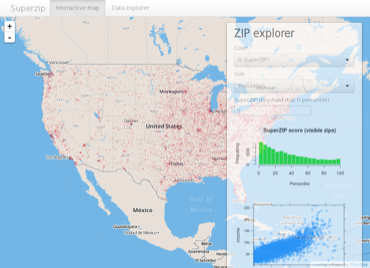
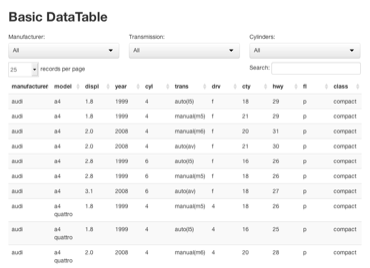
More examples and detailed tutorials how to create them can be found on Shiny website.
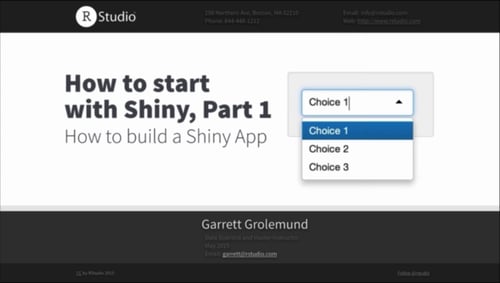
Shiny Tutorials
Shiny website provides plenty of tutorials to encourage users to develop thier own shiny application and simply share thier results on the internet.Video tutorials - The How to Start Shiny video series will take you from R programmer to Shiny developer. The entire tutorial is two hours and 25 minutes long. You can watch the complete tutorial, or jump to a specific chapter.
Written tutorials - This seven lesson tutorial from 2014 will teach you the basics of Shiny in a self-paced format. Each lesson takes about 20 minutes and teaches one new Shiny skill. By the end of the lessons, you will know how to build and deploy a Shiny app.
Graphs in R
R comes with several packages for data visialization. R enables you to chose from a variety of graphs and customize them. Moreover, all graphs can be easily integrated in any shiny application.
Examples of popular graph visualization packages
More examples and detailed tutorials how to create graphs can be found on Simple Graphs with R, Advanced Graphs, R Graph Gallery or Cookbook for ggplot2.
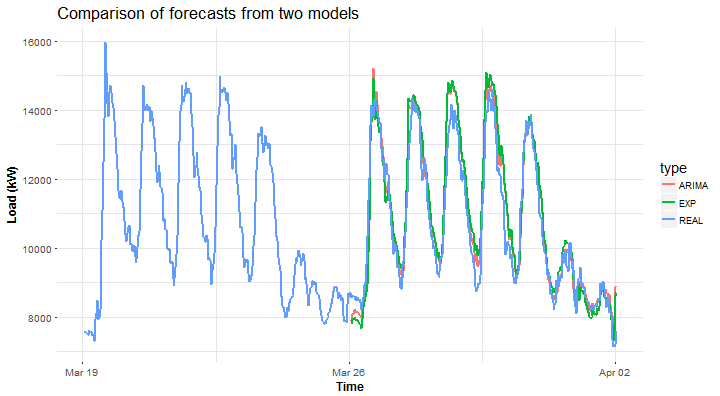
Time Series Data Mining in R
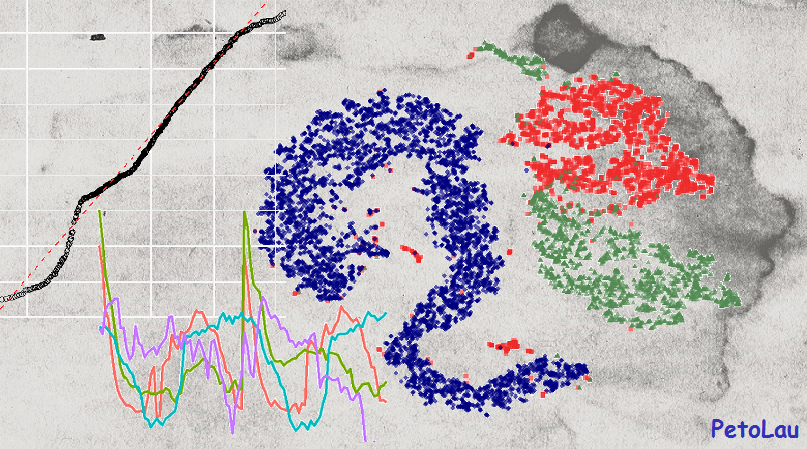
This section is belonging to tutorials, which are written within a blog of our member - Peter Laurinec.
Tutorials deal with forecasting methods, which are suitable for seasonal time series. In more detail, with forecasting methods which can handle multiple seasonalities in time series of electricity consumption. Website, petolau.github.io, source files can be simply checked on GitHub too - github.com/PetoLau/petolau.github.io.
Tutorials deal with forecasting methods, which are suitable for seasonal time series. In more detail, with forecasting methods which can handle multiple seasonalities in time series of electricity consumption. Website, petolau.github.io, source files can be simply checked on GitHub too - github.com/PetoLau/petolau.github.io.
Ensemble learning for time series forecasting in R
Written on 2017-10-19
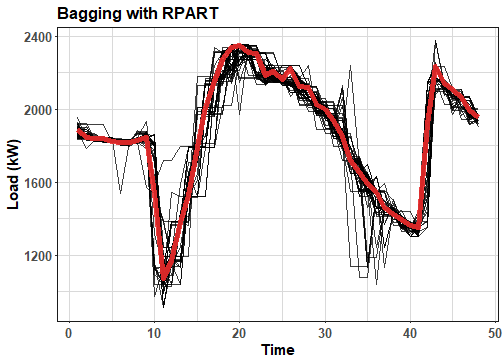
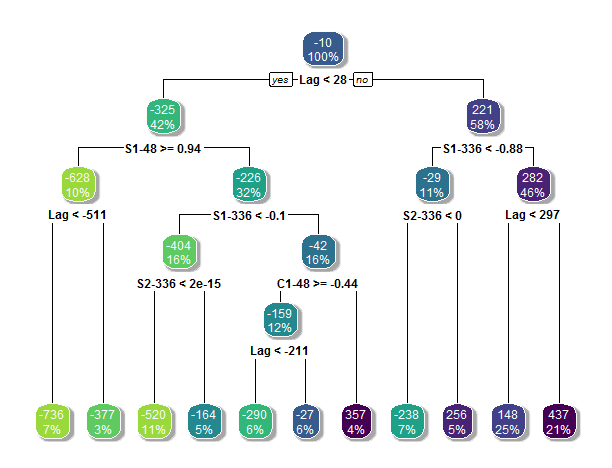
Using regression trees for forecasting double-seasonal time series with trend in R
Written on 2017-08-22
Doing magic and analyzing seasonal time series with GAM (Generalized Additive Model) in R
Written on 2017-01-24
Forecast double seasonal time series with multiple linear regression in R
Written on 2016-12-03
Enernoc smart meter data - forecast electricity consumption with similar day approach in R
Written on 2016-11-12